Rowboat
  • Pricing
  • Resources
  • Releases
Sign in
  • Library
  • Settings
  • Plan
  • Sign out

Rowboat

A lightning fast tool for understanding large datasets.

A person looking at a range of varied and colorful charts in Rowboat
Try it for free now!

Rowboat is currently unavailable.

Try reloading or opening the page on a different device.

Sign in to open a spreadsheet

Your data stays in your browser.

It will not be uploaded or shared.

Drop a file to open it in Rowboat

Rowboat is a tool for making sense of tabular data— the kind found in Excel spreadsheets and CSV files.

Rowboat is built around three ideas: understanding, interaction, and immediacy.

Understanding

Why do we work with data?

The point is not collecting, managing, cleaning, or even editing data—it’s about understanding what it means.

And the fastest way to understand data is to visualize it, answering questions before you have a chance to ask, and inspiring new questions and insights.

Interaction

What’s the best way to learn about a dataset? To interact with it.

The faster you can filter, search, explore, and navigate, the more quickly you’ll be able to make your information usable.

High speed, low-latency interactions mean you can ask more questions in less time, making it possible to quickly ask “what about…” rather than spending time constructing complex queries and waiting for responses from the cloud.

Immediacy

Why is it usually so difficult to work with data tools?

Rowboat eliminates the need to install complex software or set up a “workspace” before you’re able to look at a single data point.

Just drop a file into the browser window and instantly see what the data has to say. Everything stays private in your web browser, until you decide it’s time to upload and share.


Not quite sure what we mean? Let us show you!

Dots on a worldmap

Maritime Voyages

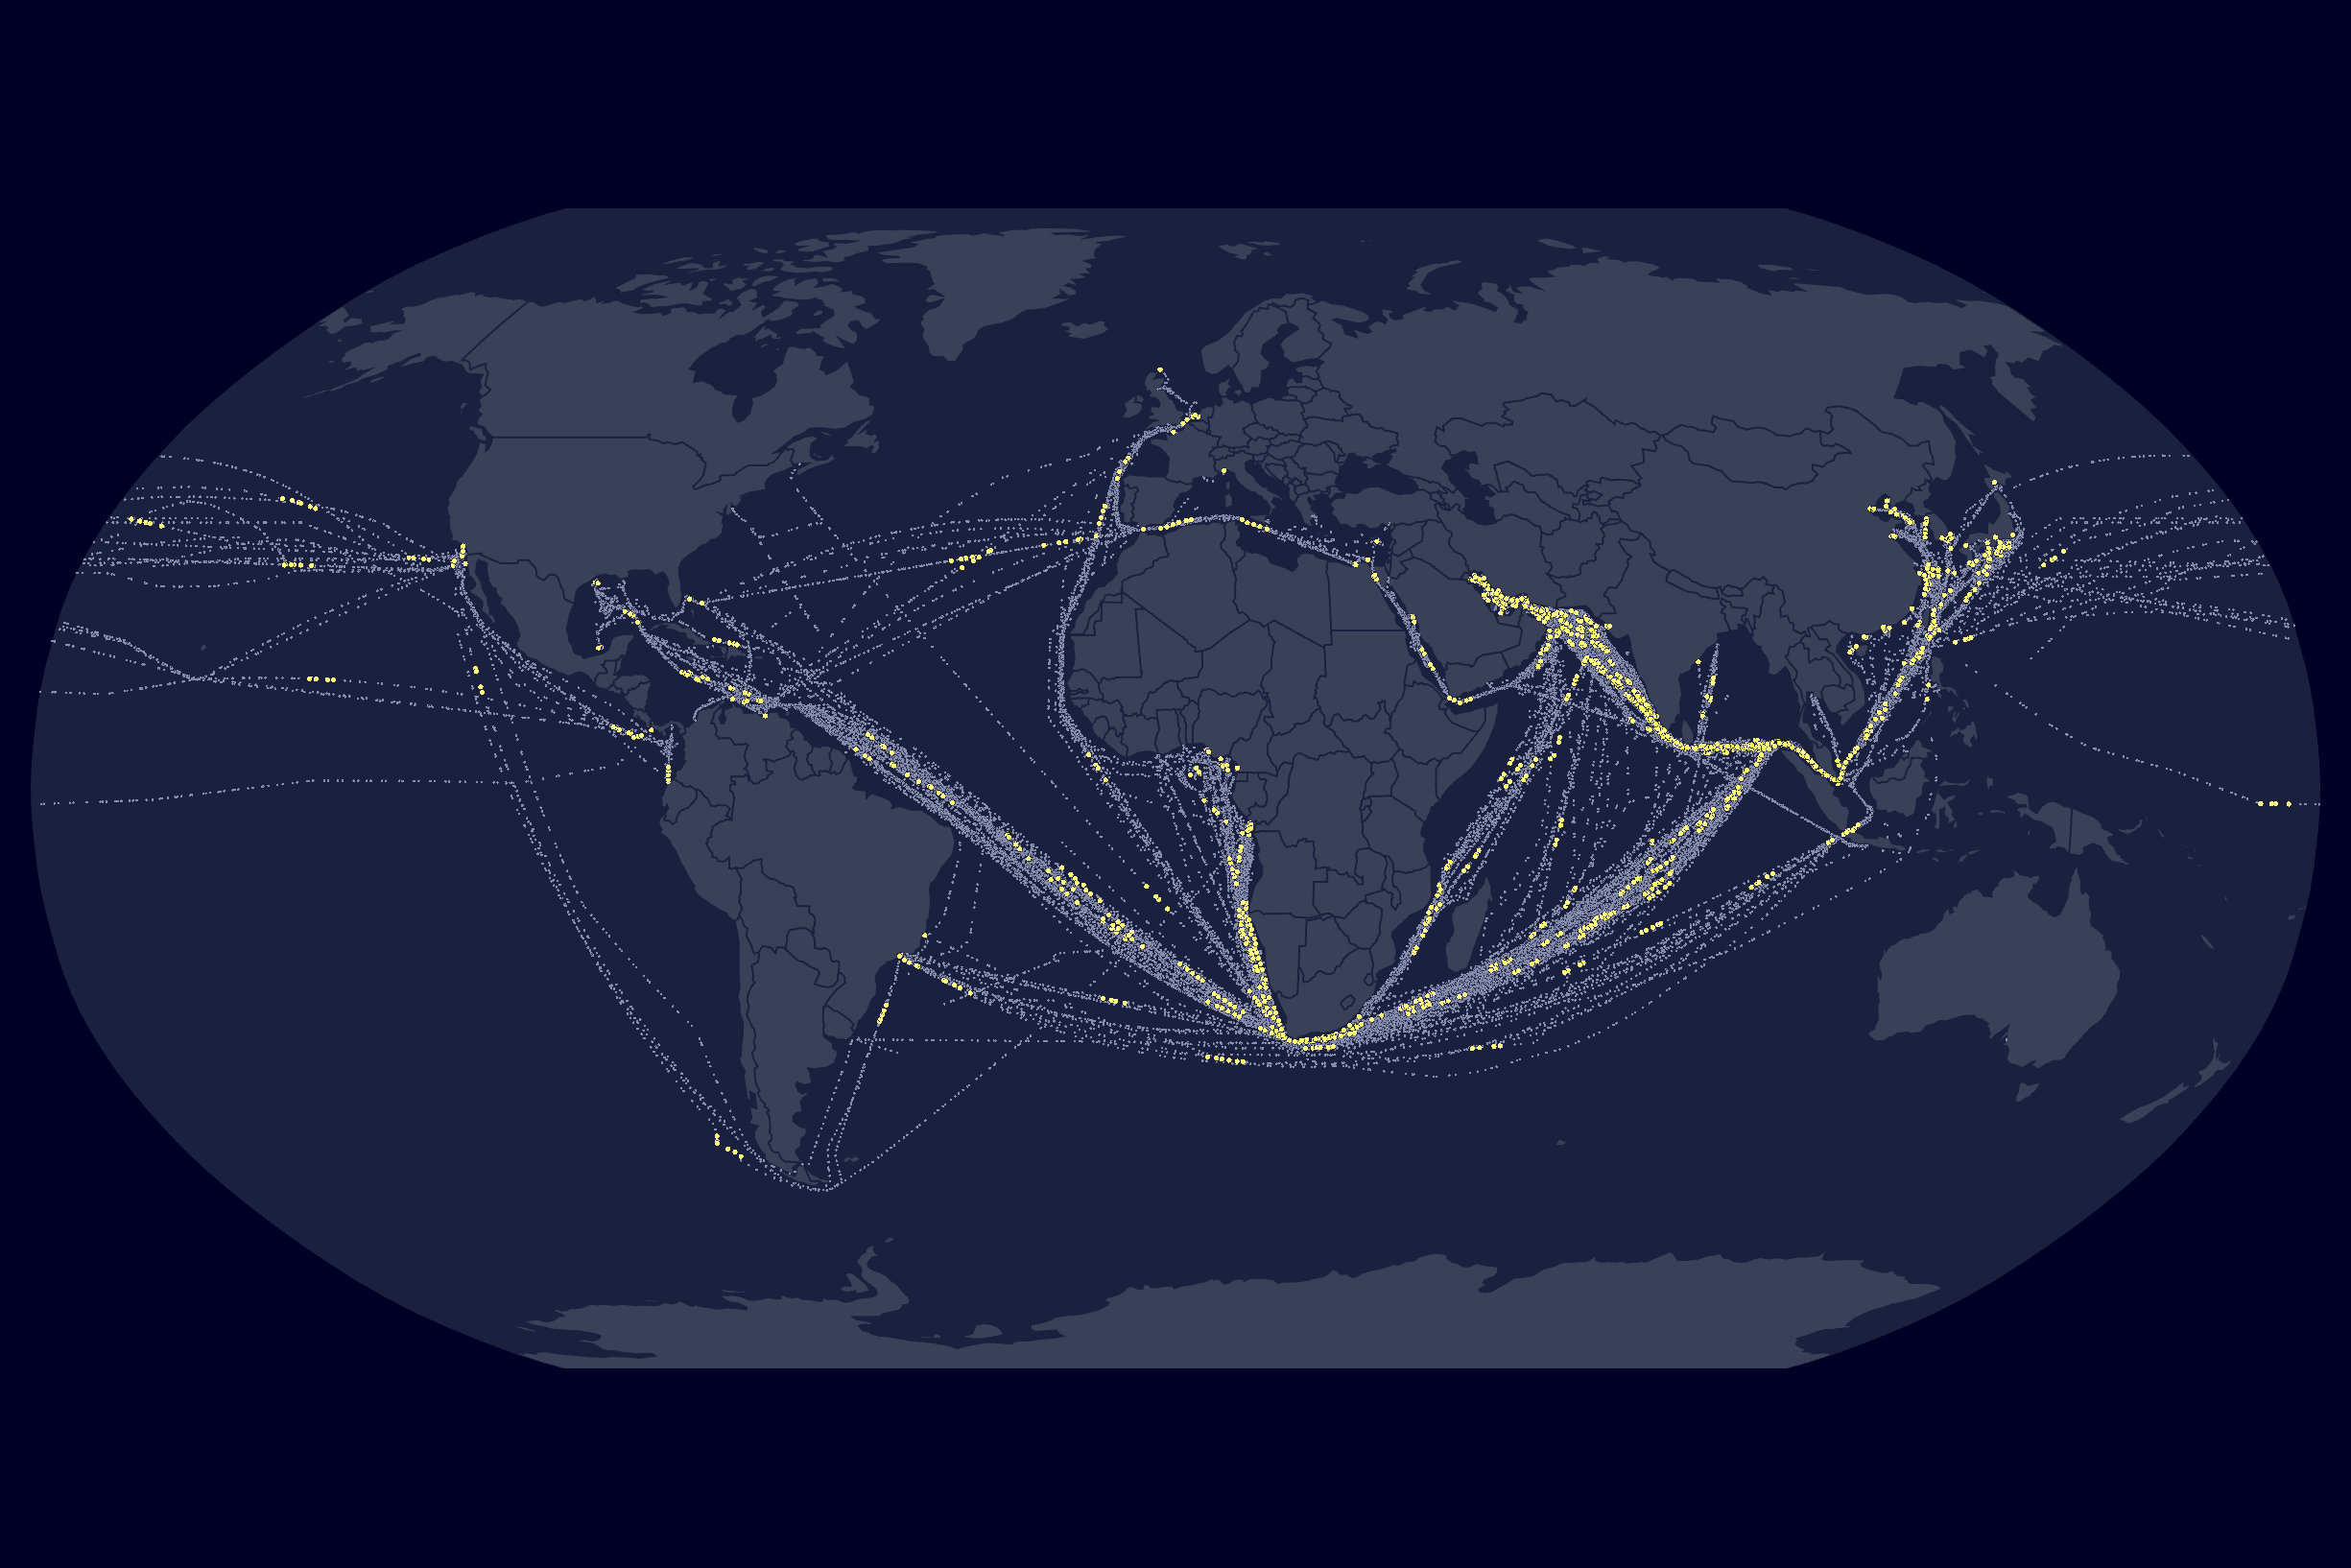
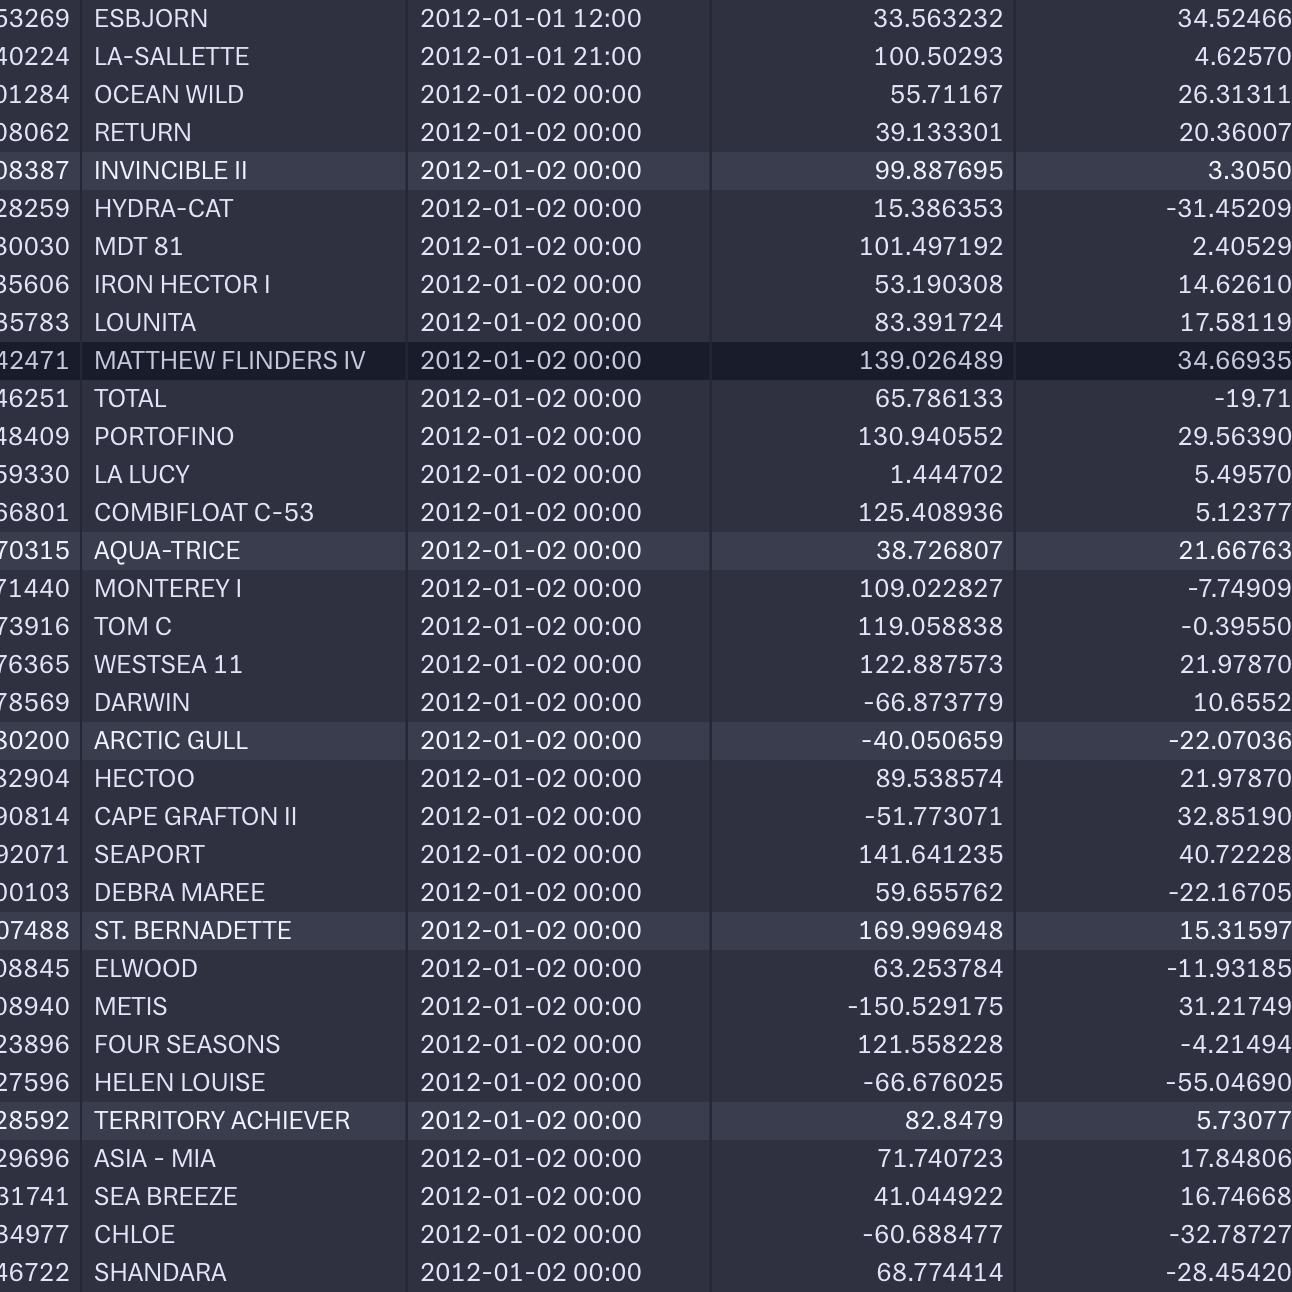
Follow the shipping routes of 500+ commercial vessels over a two-month period. Start with a bird’s-eye view of the most heavily trafficked coordinates, then filter down to see the path of each individual ship. Automatically map latitude and longitude coordinates, then use time data in another column to play back the ship’s precise movements.

Rowboat is currently unavailable.

Try reloading or opening the page on a different device.

Scatterplot of daily fuel use against miles per day

Massachusetts Highway Traffic

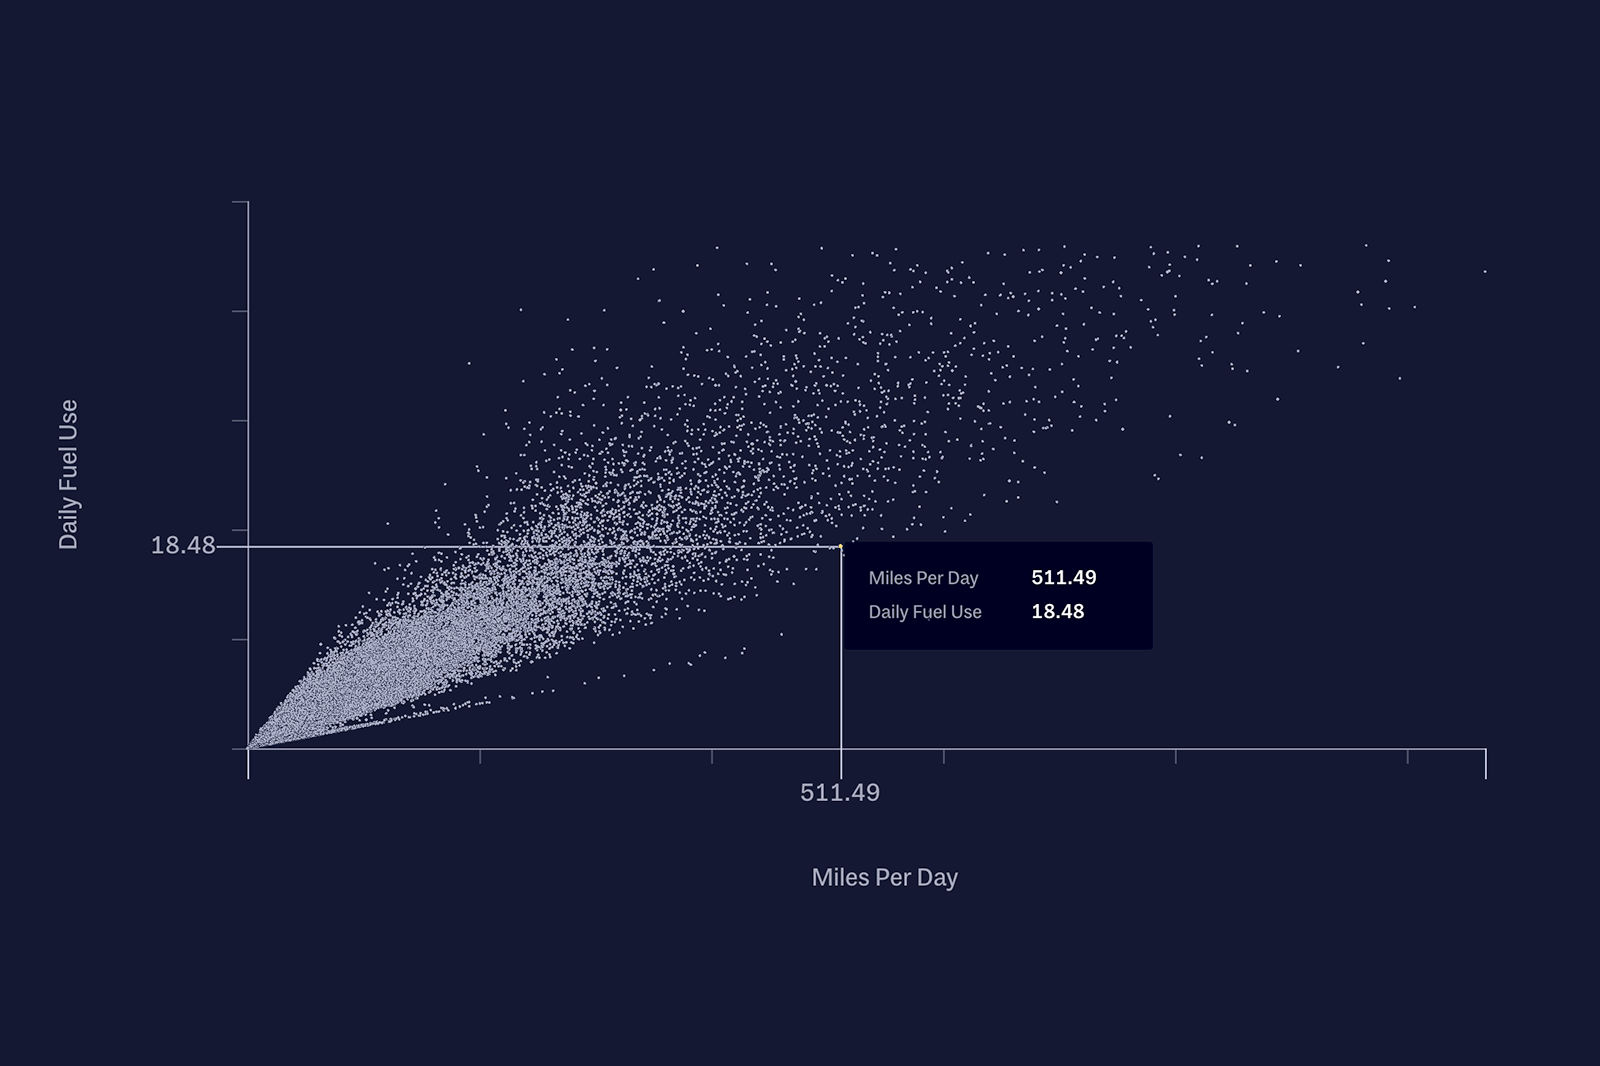
One million rows in one second. Filter and slice the data by car, truck, and SUV versus mileage, make, and model. Place of registration is mapped instantly. Complex questions answered with no code, and no clunky interface. Easily locate outliers, discover trends over time, and see how quickly you can start to understand over 100 megabytes of data.

Rowboat is currently unavailable.

Try reloading or opening the page on a different device.

Small charts visualizing data for city, state, shape, duration (seconds), duration (hours/min), and country

UFO Sightings

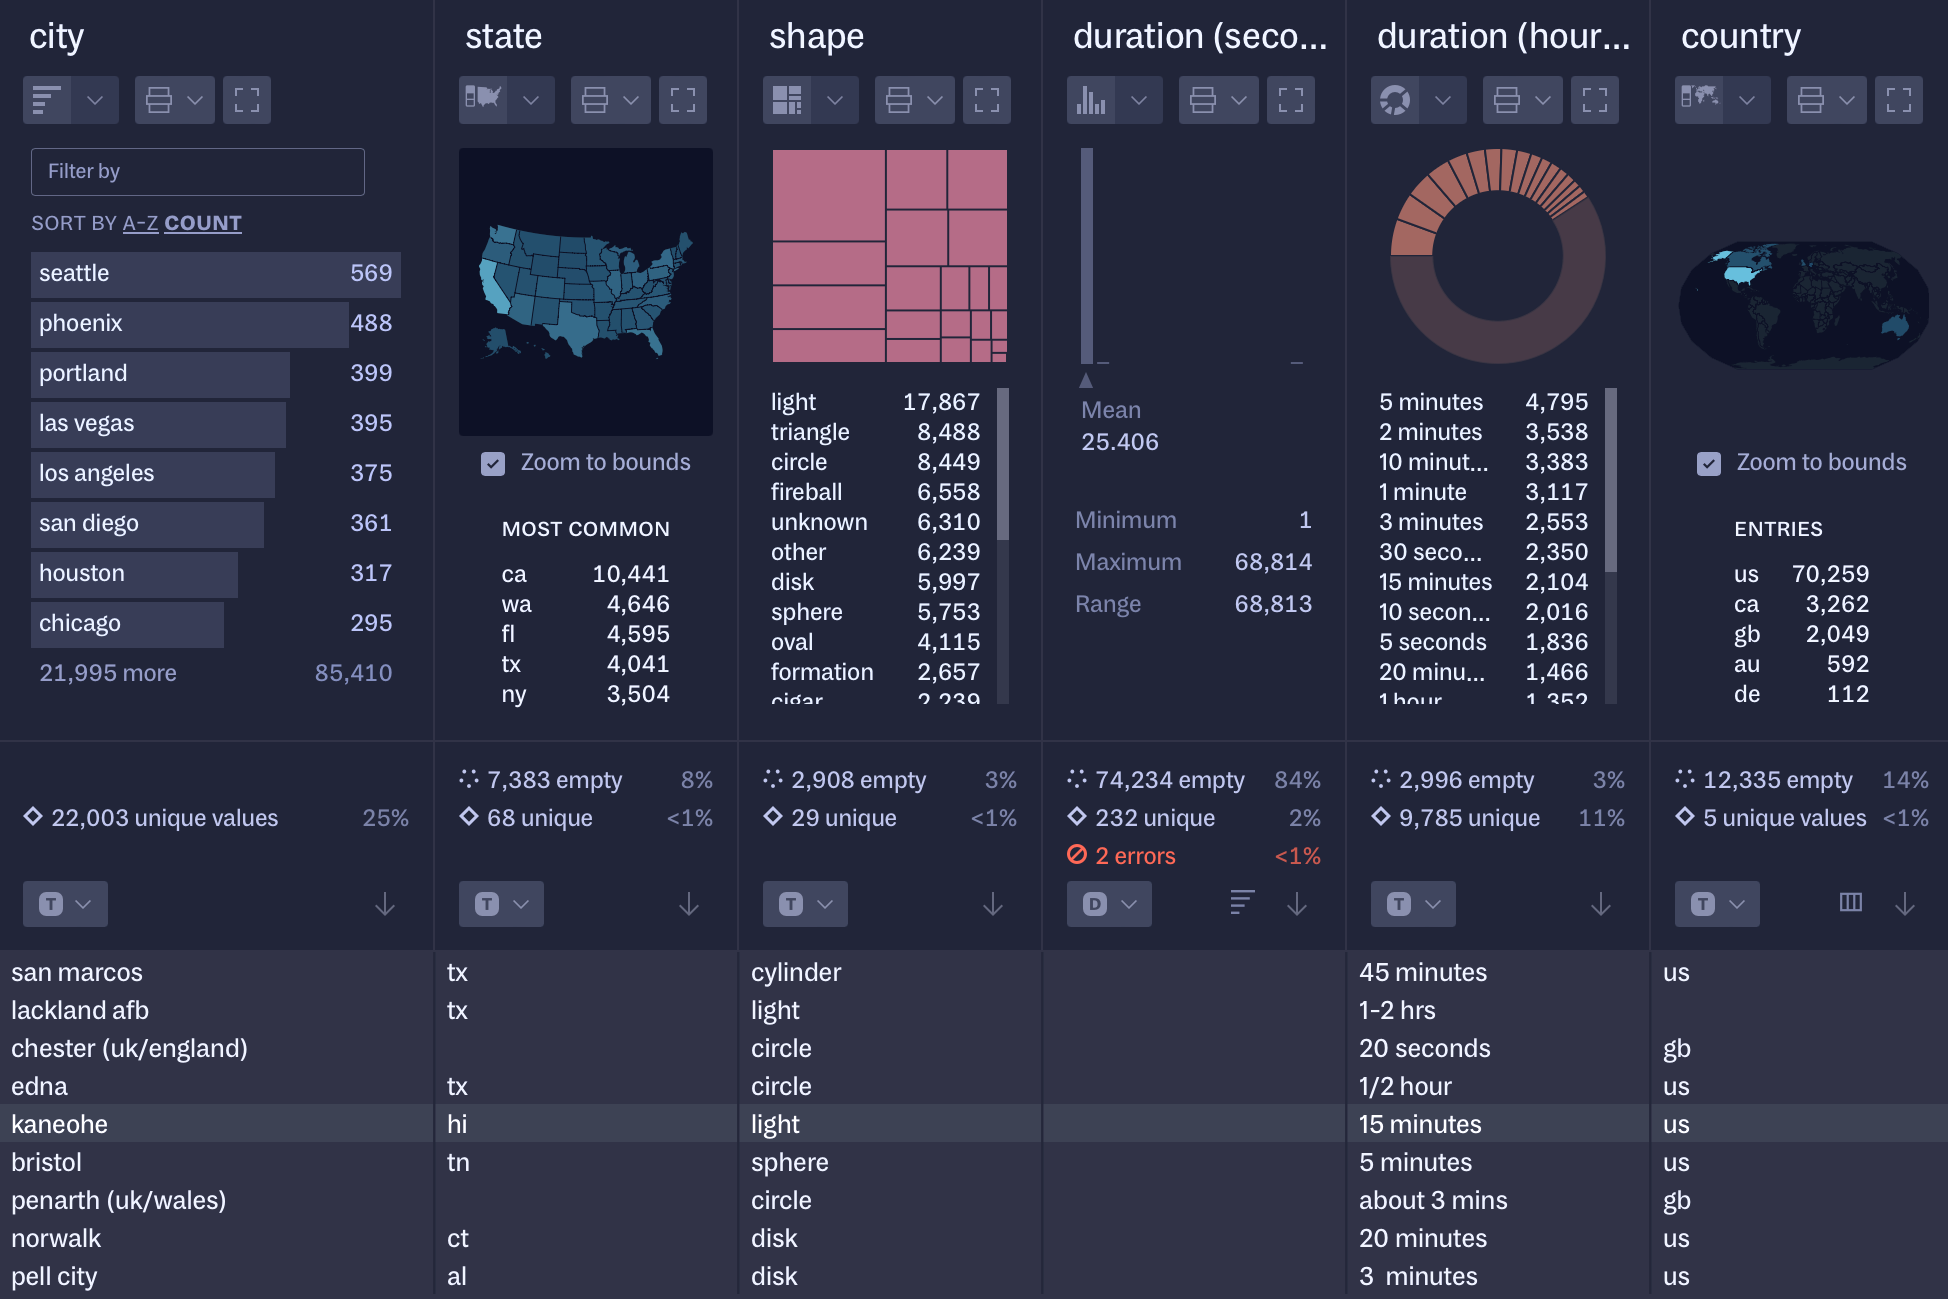
What can we learn from 88,000 reports of UFO sightings from around the globe? Quickly get a sense of which countries have reported the most flying saucer sightings, how long the average “alien encounter” lasts, and consider why so many Americans have seen suspicious fireballs in the sky on the Fourth of July.

Rowboat is currently unavailable.

Try reloading or opening the page on a different device.

An array of colorful donut charts

Survivor Contestants

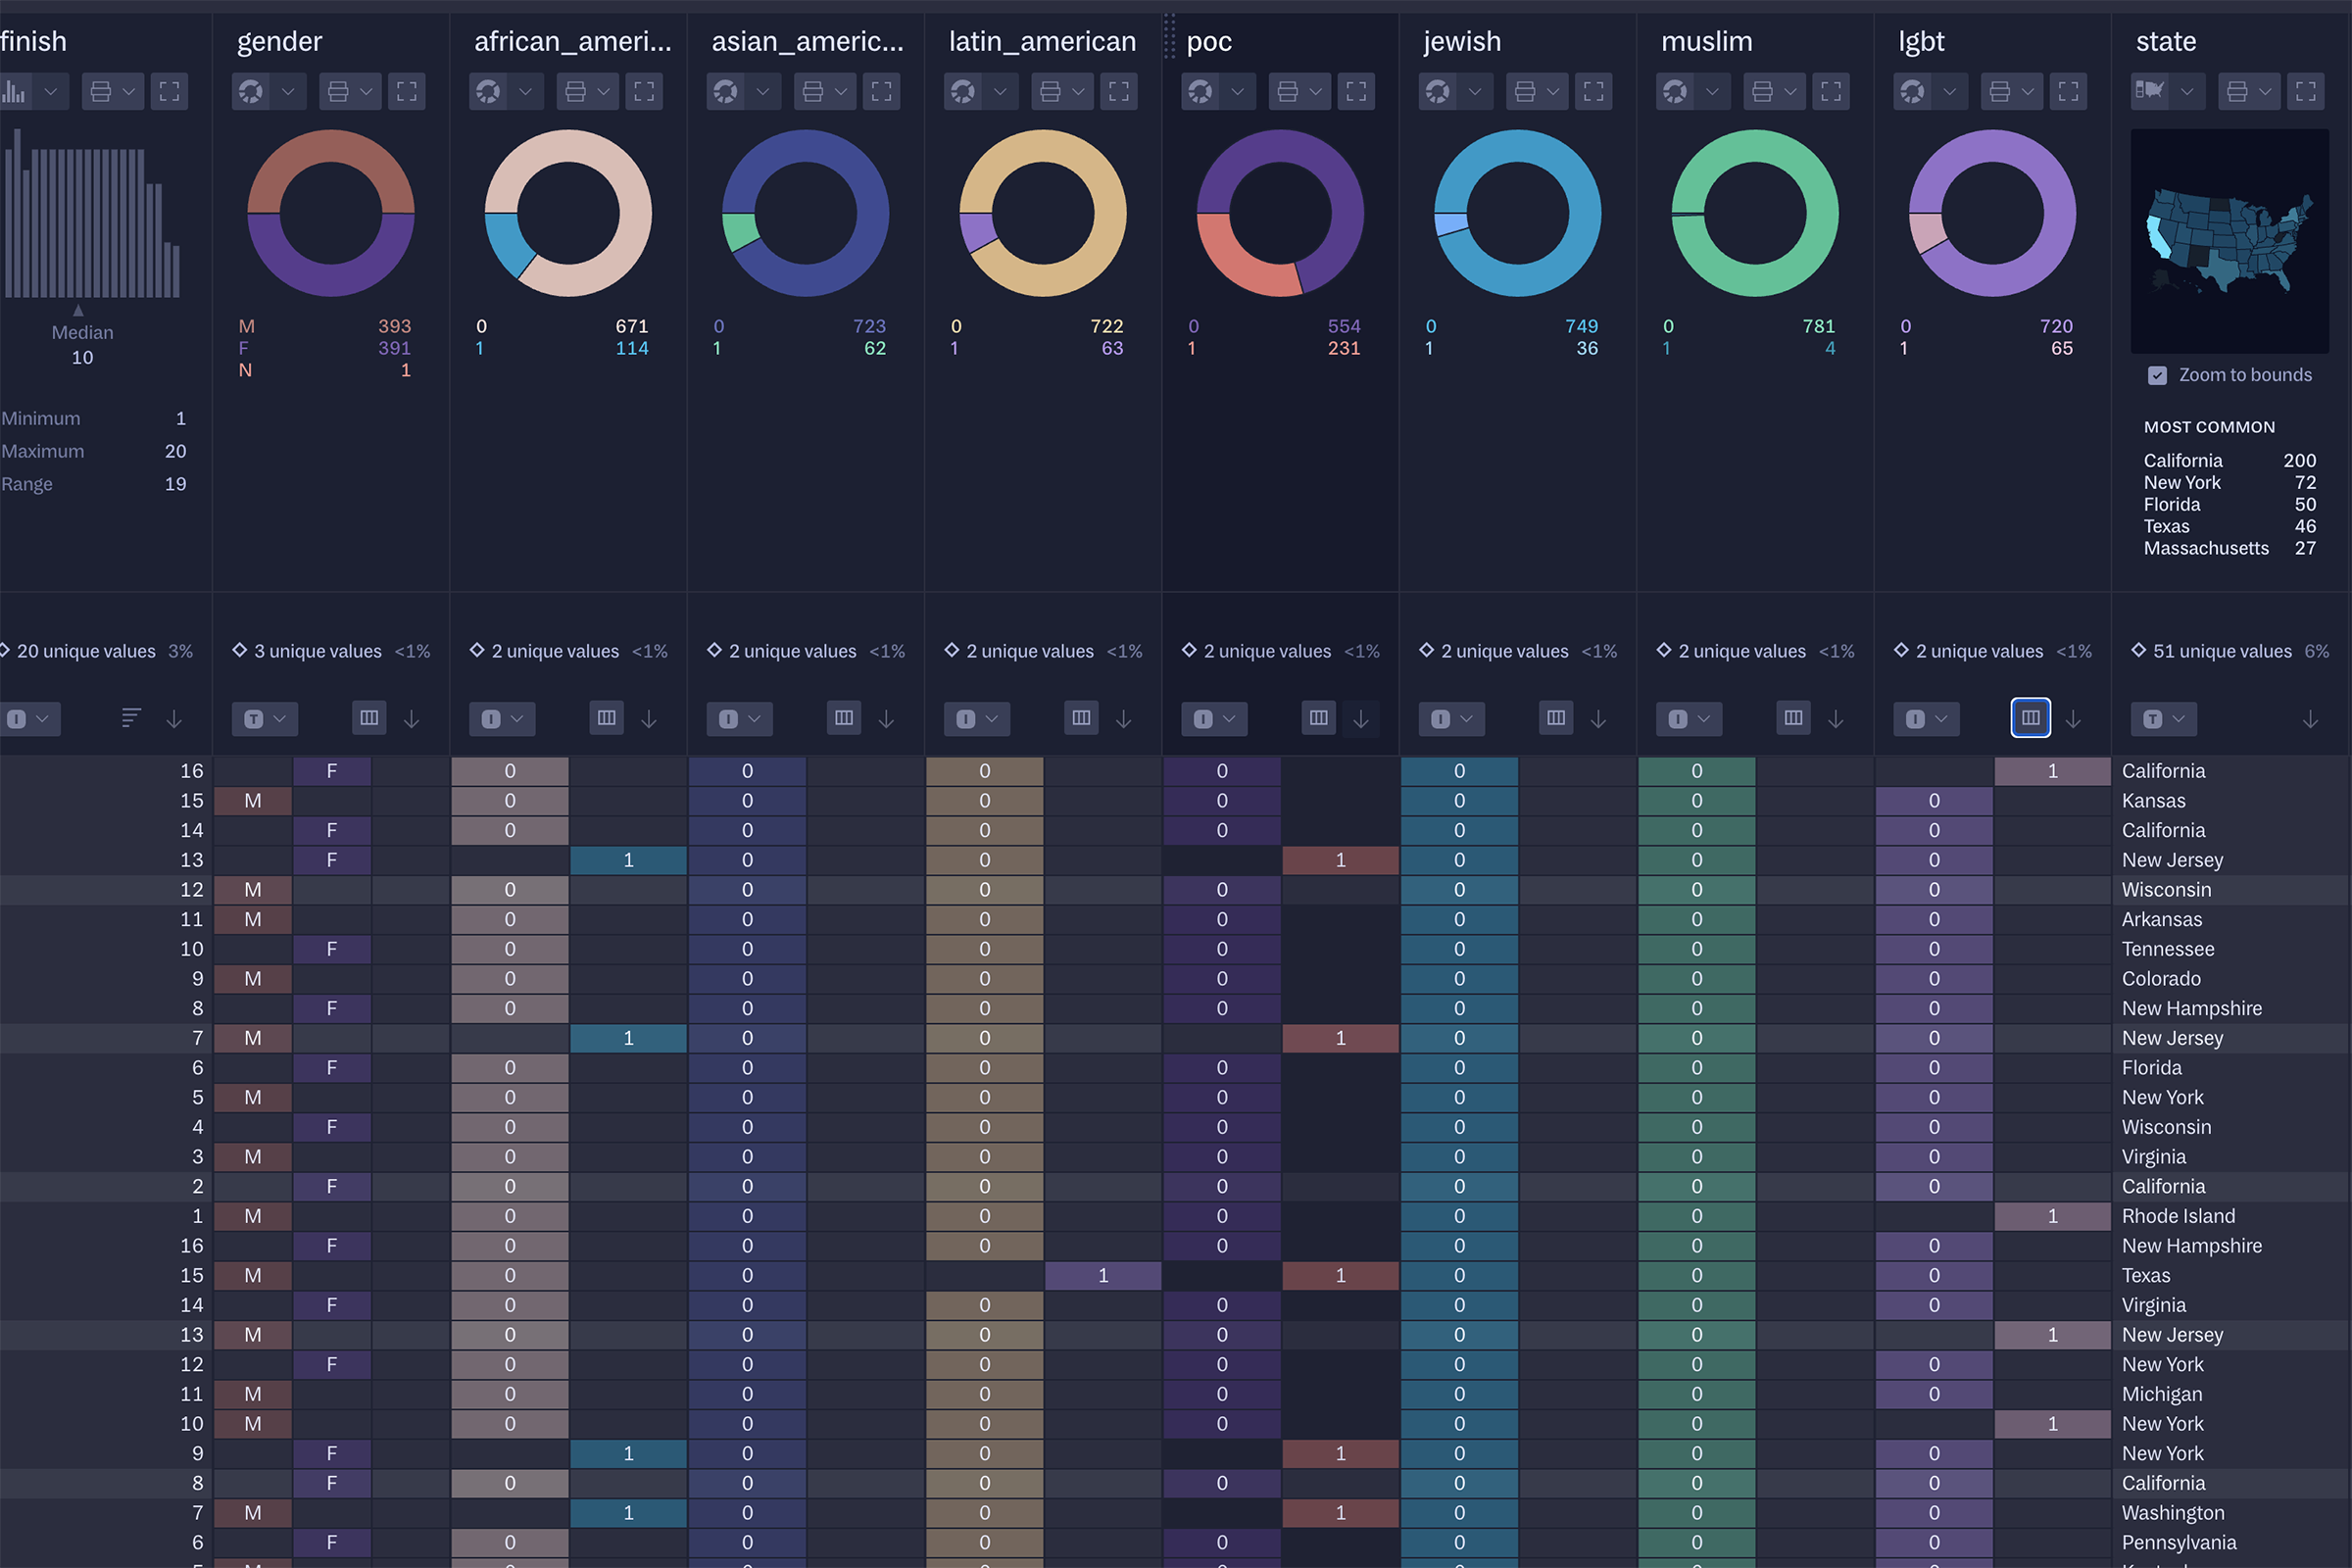
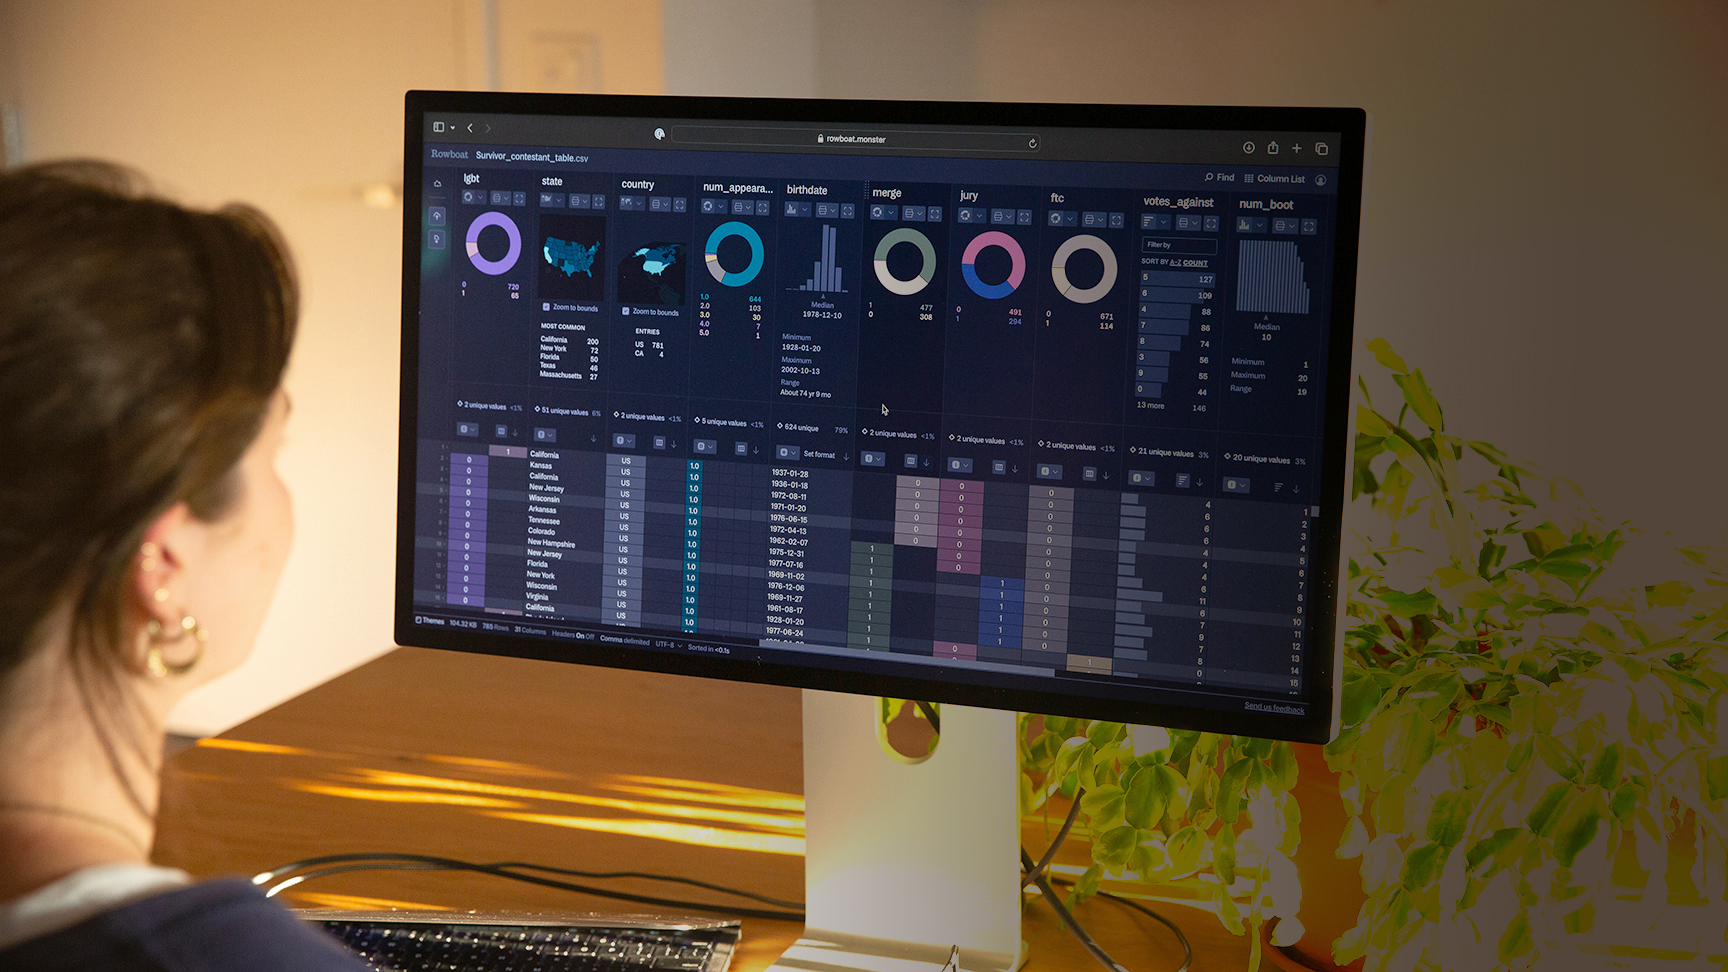
Regardless of how you might feel about reality TV, Survivor has lived up to its name and remains an institution after two decades. Sift through 40 seasons of contestant demographics and note the lack of obvious similarities between the winners. That being said: having an occupation other than “lawyer” will consistently increase your chances.

Rowboat is currently unavailable.

Try reloading or opening the page on a different device.

Feature highlights

A series of colorful donut charts

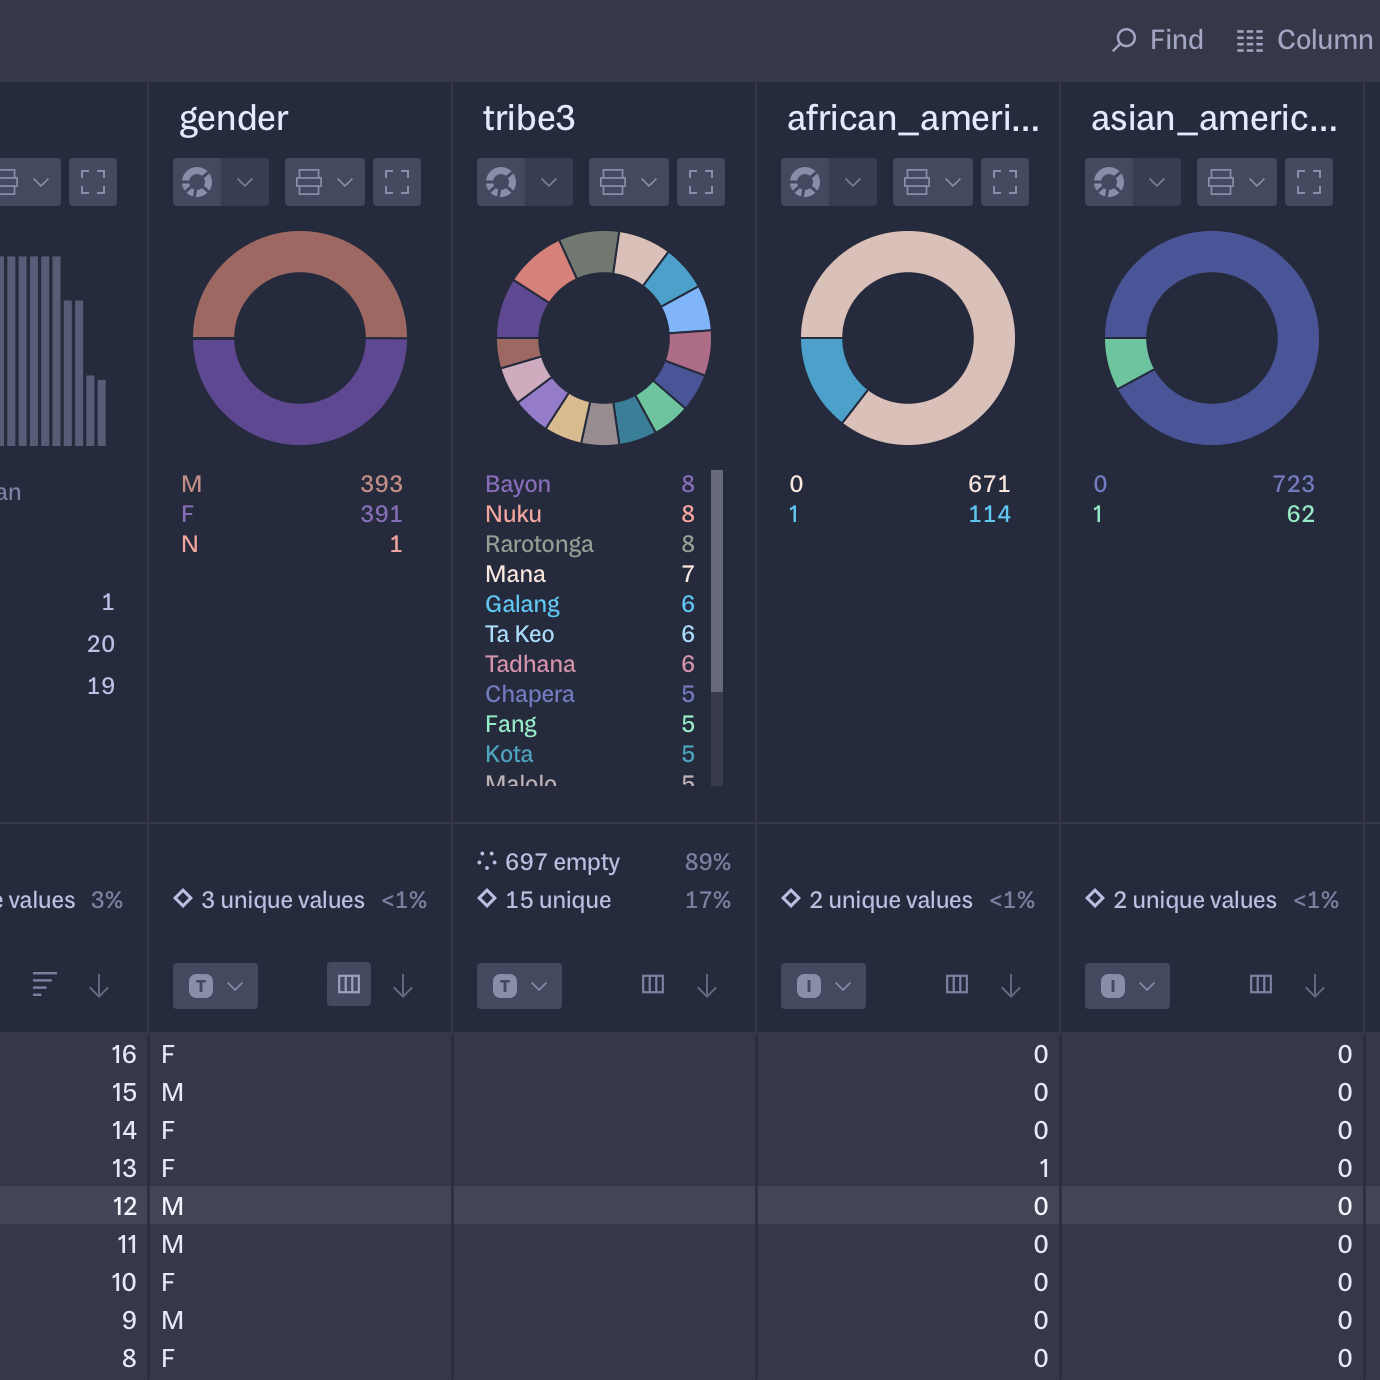
Get an instant visual breakdown of your file without having to navigate away from the data itself.

A zoomed-in portion of a US county map, colored according to data

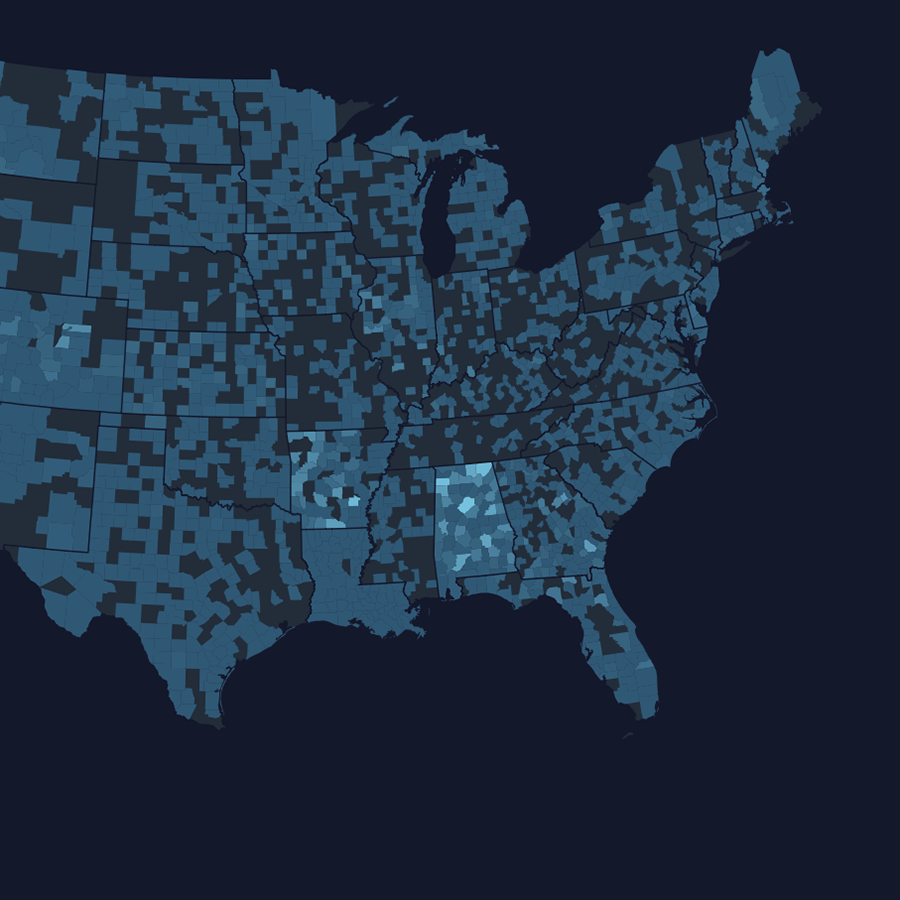
Does your data set involve U.S. counties? See it mapped across the U.S. in two clicks.

Small charts in Rowboat, alternating between different themes

Do you have a passion for dark mode? Light mode? Submarine mode? Pick the palette most soothing to your retinas.

Rows of data in a spreadsheet

No installation needed. And your data stays private in your browser (at least until you choose to share it).

Who are we?

Rowboat was developed by the team at Fathom Information Design. We’ve distilled what we’ve learned from years of experience building custom software and tools for understanding complex datasets. Since 2010, we’ve partnered with everyone from Fortune 500s to non-profit organizations across a broad range of sectors, including health care, education, financial services, media, technology, and consumer products.

With Rowboat, we’ve created a tool that encapsulates a core part of our process—that initial moment of understanding a dataset—in a way that can be used by anyone, and without having to learn complex tools or write custom code.

GE logo
National Geographic logo
Google logo
Nike logo
Robin Hood Foundation logo
State Street logo
Volkswagen logo
World Bank logo
Gates Foundation logo
Stanford logo
JP Morgan logo
Warner Bros logo
Harvard logo
athenahealth logo
Samsung logo
Terms of Service Privacy Contact Us
© Rowboat LLC
Fathom
Instagram

Rowboat

Choose a column to see with on a chart type.

No other column can be linked with . See Resources for more information.

Choose a column to join with .

(ignore case)
Sign in
  • fred-test@fathom.info
  • Library
  • Settings
  • Plan
  • Sign out
Find
    Local Uploaded

    Uploading a file to your Library is a premium feature.

    Sign in to learn more.

    Learn more about Rowboat+

    An illustration of a spreadsheet curled inside a glass bottle, floating on water.

    The file you are attempting to upload will exceed your account's storage limit.

    Delete other files to make space for this dataset, or try uploading a smaller file.

    Sharing is a premium feature.

    Sign in to learn more.

    Learn more about Rowboat+

    An illustration of a spreadsheet curled inside a glass bottle, floating on water.

    Exporting a file is a premium feature.

    Sign in to learn more.

    Learn more about Rowboat+

    An illustration of a pie chart on a sparkling page.

    Drag column

    Column 1

    Show hidden column
    Column 1

    Left column

    Right column

    Date format

    Enter a format in strptime date notation.

    Not sure how this works? Here are some typical formats.

    Format Example
    03/31/24
    31/03/24
    March 31, 2024
    18:22:43
    6:22:43

    Merge items in

    Filtered to Showing
    Select additional entries to merge.
    Showing of entries.
    No changes.

    No matches

    columns
    have error
    0
    columns are
    over % empty
    Filtering to columns matching “”

    All empty columns are hidden.

    All single-valued columns are hidden.

    Linked columns
    Format

    Upload a text file with one column name per line.

    Retrieving file...

    Please select a worksheet to open:

      0 Bytes
      0 of 0 Rows

      Hide 0 empty?

      0 Columns (0 hidden)
      Headers
      to edit header row
      Delimiter
      Show whitespace
      Saving… Saved.
      Questions? Feedback?
       
      Label by
      Add label
      Color by
      Select columns
      Group action
      Over time
      Scale By
      Animate over time

      Exporting a chart is a premium feature.

      Sign in to learn more.

      Learn more about Rowboat+

      An illustration of a pie chart on a sparkling page.

      and

      and

      No entries within this time range

      Upload this file as…

      Uploaded to library.

      Share file-name.csv

      File link

      Link copied to clipboard

      Who can view

      Anyone with the link can view this file.

      Only invited viewers who are logged in can view this file.

      Invited users

      No viewers are invited.

      inviteduser@gmail.com

      Save a copy of file-name.csv

      Options

      Copied to library at

      We couldn't share your file right now.
      Please make sure you are logged in and try again, or contact us.

      Export file-name.csv

      Separators

      Options

      Example tool

      This tool lists out the 0 columns in this file.

        Themes

        Split on
        Case

        All leading and trailing whitespace will be trimmed.

        Rowboat